ぐにゅーぷろっと。
これが僕のグラフだ!!
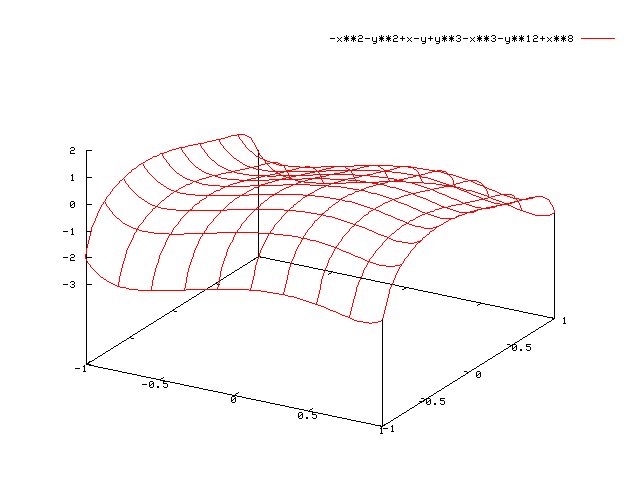
                          gnuplot> set xrange [-1:1]
                          gnuplot> set yrange [-1:1]
                          gnuplot> set zrange [-3.3:2]
                          gnuplot> splot -x**2-y**2+x-y+y**3-x**3-y**12+x**8
                          gnuplot> set terminal png
                          Terminal type set to 'png'
                          Options are 'small color picsize 640 480 '
                          gnuplot> set output "gnu.png"
                          gnuplot> replot