式
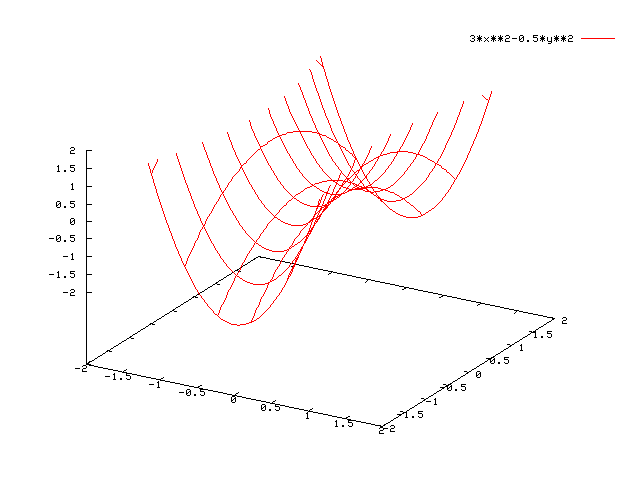
set xrange[-2:2]
set yrange[-2:2]
set zrange[-2:2]
splot 3*x**2-0.5*y**2
式
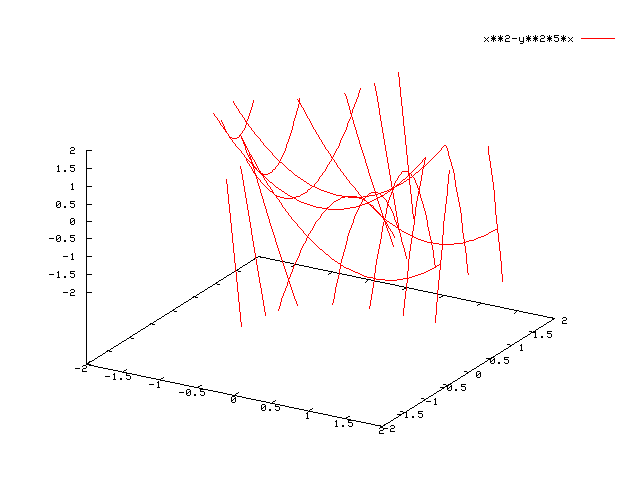
set xrange[-2:2]
set yrange[-2:2]
set zrange[-2:2]
splot x**2-y**2*5*x
課題のためにgnuplotdで作ったものです。なんとなくで、2つ作ってみました。
戻る